Becoming a Better Investor Through Portfolio Analysis
It’s ironic: for an industry that regularly invests in the bleeding edge of modern technology, venture capital firms find themselves lacking the tools necessary to analyze their own portfolios. Portfolio analytics—the accurate collection and streamlined interpretation of metrics at the security, company, and portfolio (or “fund”) level—doesn’t seem like it should be too much to ask of VCs. So why settle for anything less than a near-real-time view of how your fund is performing?
“Elite investors know their numbers, no matter what.”
The best investors are committed to collecting and analyzing their portfolio metrics for well-informed scenario analysis, smarter capital deployment, and better investor relations. This practice can ultimately only lead to one of two outcomes: you either amplify your fund’s performance or sharpen the efficacy of future projections. In this article, we’ll explore best practices for measuring, monitoring, and managing a healthy and successful portfolio. And remember, Diligent Equity helps VC firms manage their portfolios so request a demo here of our portfolio management software!
Metrics for Monitoring Portfolio Performance
In venture capital investment, there’s no single stat you can point to as a catch-all indicator of success. The closest thing to a comprehensive measure of success is a combination of two “go-to” metric categories: “multiples” and “IRR”. Each category breaks down into two subcategories: “gross” and “net”.

Multiples
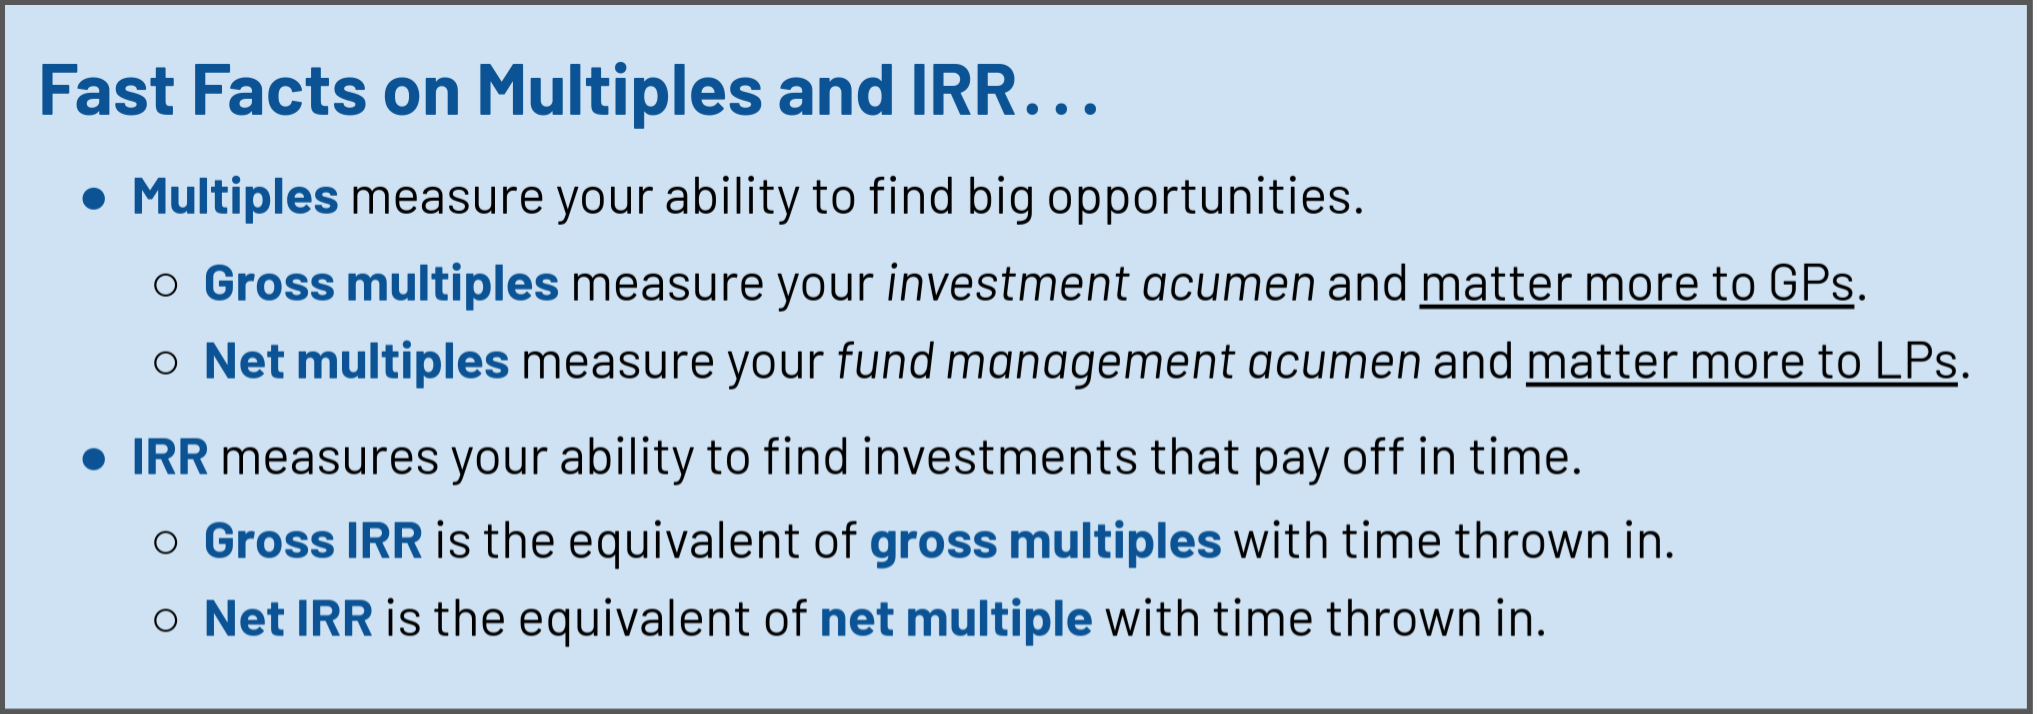
Multiples measure your ability to find big opportunities. As a whole, multiples are concerned with the magnitude of returns you create as an investor. This category of investment metric breaks down into gross multiples and net multiples. It’s important to note that multiples do not consider the time value of money.
Gross Multiples
Gross multiples are an effective measure of your investment acumen; your strength as an investor. These metrics ultimately matter more to a GP.
 It’s worth noting that the only difference between MOIC and Gross TVPI is the denominator:

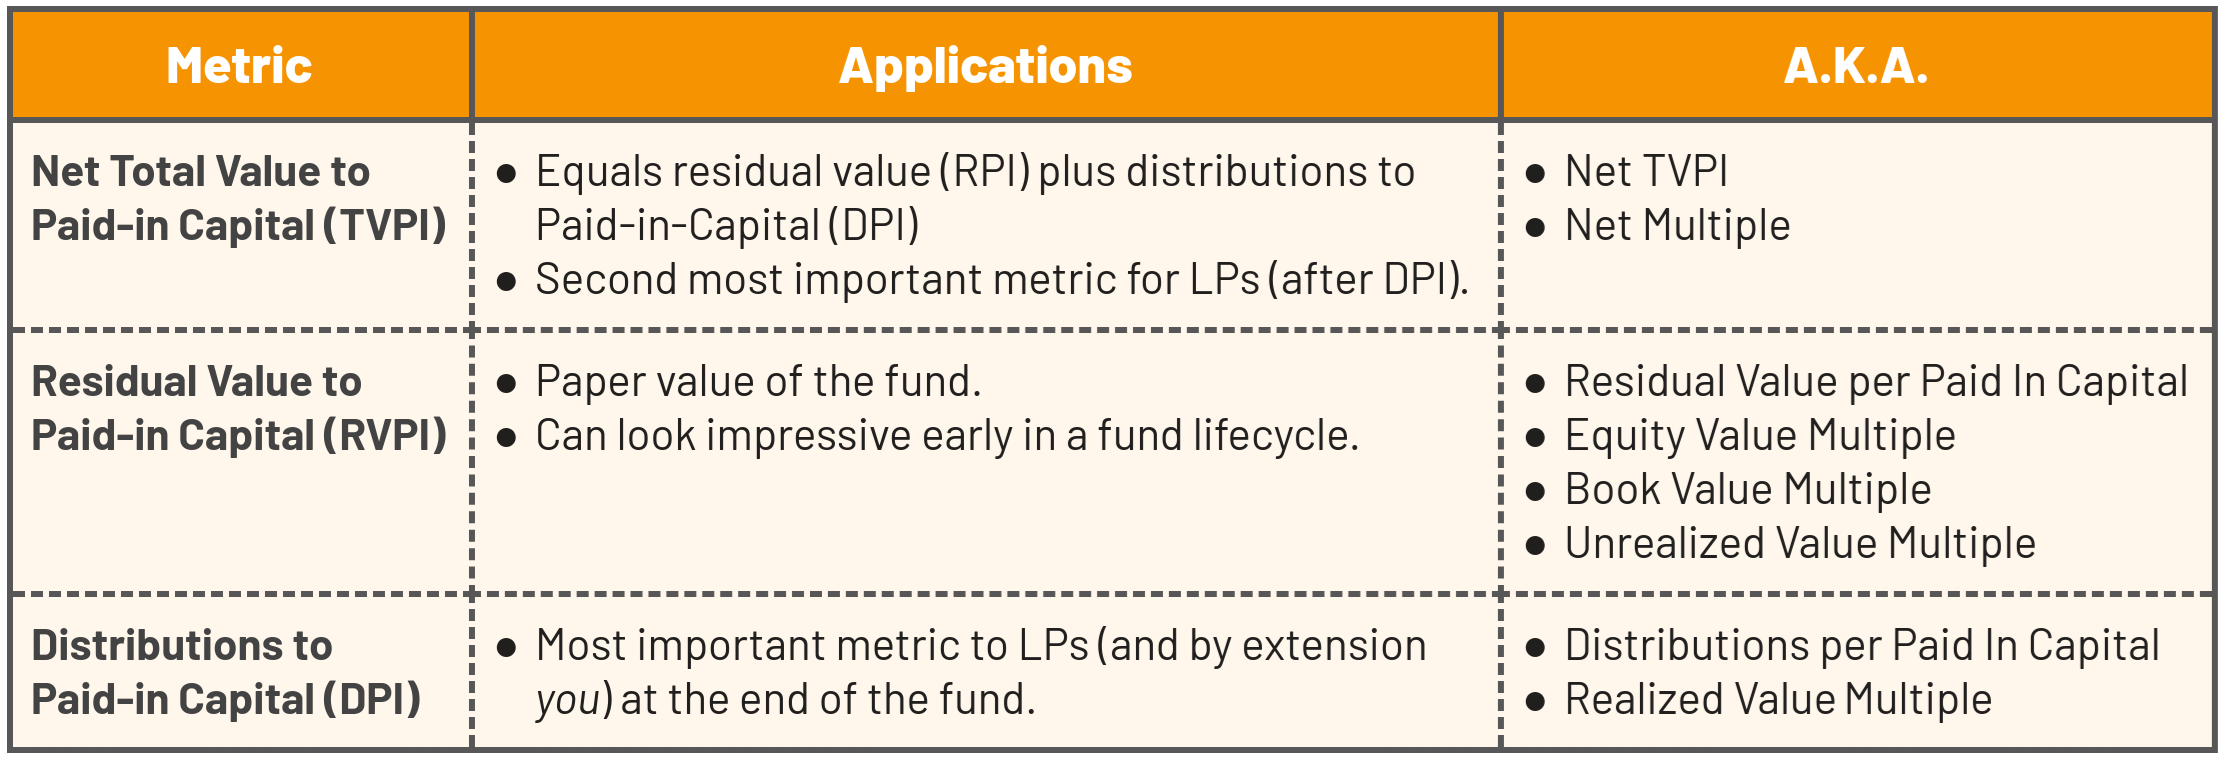
When communicating with LPs, fund admins, portfolio companies, and other GPs, it’s important to clarify whether “gross multiple” refers to either multiple on invested capital (MOIC) or multiple on paid-in capital (gross TVPI). “TVPI”, on the other hand, almost always means “net TVPI”.
Net Multiples
Net multiples are more indicative of your strength as a fund manager (as opposed to simply an “investment selector”). These ultimately matter more to an LP. Net multiples provide a more realistic view of an LP’s return on investment (ROI) after subtracting for management fees, carried interest, and other factors. Because of the significance LPs place on net multiples, this metric often plays a larger role in determining the strength of a fund.
 There’s no single “right way” to provision for carry, fees, and expenses to arrive at net multiples. So always make sure you’re comparing ’apples to apples’ if you’re comparing your net multiple with another GP.
Investors look at several multiples to get a more realistic view of a fund’s performance. Multiples can provide both GPs and LPs with an effective resource for benchmarking. These metrics offer more insight into the health of a fund in its later, more mature stages, as there tends to be a higher degree of variability while capital calls are still being made.
IRR
Internal rate of return (IRR) measures your ability to find investments that pay off in time. IRR focuses on the velocity of returns you create as an investor (i.e. the speed at which you deliver an ROI). This category of investment metric breaks down into “gross IRR” and “net IRR”. Unlike multiples, IRR considers the time value of money.
Gross IRR
Gross IRR measures the total return on investment (before subtracting for fees, carry, etc.) over a set period of time (e.g. quarterly, biannually, or annually).
 It’s important to clarify whether paid-in capital (PIC) or invested capital is being used to calculate gross IRR. It can make a very substantial difference. Gross IRRs can be applied at the security, company, and fund level.
Net IRR
Net IRR is a variant of the internal rate of return which takes management fees, carried interest, and other such factors into account.
 When calculating the unrealized value of IRR, there’s no standard method for agreeing on provisions for carry, fees, and expenses. As with net multiples, net IRRs are only used at the fund level. There is no realistic net IRR for an investment in a company or a security.
It helps to think of gross IRR and net IRR as being the equivalent of a gross multiple and net multiple (respectively) adjusted for time. LPs typically choose to focus on net IRR, as this metric provides a stronger indicator of their actual return on investment. GPs love to use gross IRR in marketing as it’s easier to advertise attractive returns before management fees, carried interest, etc. have been withdrawn.
Solutions for Managing Your Measurements
Simply telling you to keep meticulous, near-real-time measurements of portfolio performance is pointless. The obvious response being, “no duh. If it were that easy, everyone would do it!”.
Truth is, it’s hard to keep an accurate, up-to-date record of performance metrics for a number of reasons. Depending on the makeup of your portfolio, companies’ metrics may not follow a traditional organizational structure. Some may lack data points on which to report. For emerging or first-time fund managers, it can take a while to hear back from fund admins on multiples and IRR.
Regardless of how well you’ve optimized the workflows surrounding the collection and maintenance of portfolio analytics, you’re bound to encounter limitations. At some point in the lifespan of your fund, an LP will ask you questions you don’t have a good answer for.

It’s moments like these when it helps to fall back on an organizational setup you’re comfortable with (whether it’s a specific software or a broader methodology). GPs have a few options for tackling the challenges of measuring, monitoring, and maintaining their portfolio analytics. Each carries a unique set of advantages and drawbacks, making them ideal in some scenarios; less so in others.
Spreadsheets
VC firms often rely on spreadsheets to record their portfolio metrics. You will likely need a spreadsheet model for every investee in your portfolio. While spreadsheets are easy to set up, automating data collection and implementing real-time or integrated reporting can be difficult without a sophisticated means of linking and rolling up the information. This means you’ll likely need to update your spreadsheets for each meaningful event (such as changes to a cap table). Spreadsheets often contain redundant data, which invite errors and bad reporting.

Cap Table Software
Investing in a cap table management platform can offer a quick and easy solution for managing equity at the company level. GPs may experience difficulties aggregating data from across their portfolio at the fund level. It’s also not uncommon to encounter integration obstacles—often in cases for which multiple cap table managers are being used between portfolio companies.

Investment Management Software
There are a variety of portfolio monitoring solutions on the market. Diligent Equity is one of them and provides substantial benefits to VCs as it centralizes all the data into a single location that can be integrated and reported on at will.
Beyond that, extending software licenses to LPs and portfolio companies can mean upgrading to more expensive product tiers (rarely feasible for funds under $500 million AUM). In most cases, it still falls on you to do the heavy lifting involved in keeping things organized.

The ideal portfolio analytics solution can vary from fund to fund. While it’s important to find solutions that bring you closer to “pie-in-the-sky” status (a single accurate and up-to-date source of truth—shared with LPs and portfolio companies—across your entire portfolio), if ramping up the complexity stands in the way of a commitment to regular monitoring and maintenance, you’re better off sticking to what you’ve got.
Conclusion
The best VCs hold themselves to a high standard of professional accountability and as such, feel obligated to monitor, maintain, and interpret their portfolio metrics. Having as close to a real-time view of how your fund is performing is important, even from day one; even when you don’t think you need it. Leveraging the additional information offers myriad benefits, paving the way for smarter capital deployment, better investor relations, as well as increased precision and accuracy in modeling what-ifs and liquidation scenarios.
The closer you get to achieving that always-accurate, always up-to-date, pie-in-the-sky, “gold standard” of portfolio analytics—a single source of truth with zero sources of stress—the more you realize why committing to the disciplined monitoring and maintenance of fund metrics is one of the best investments you’ll ever make.
